

If there was a way to reduce road congestion while increasing the speed limit, without the need to build additional highway lanes, would we not be excited? In T&D, we can do it through Dynamic Line Rating (DLR), and make the grid ever more resilient, reliable, safe, and reduce cost.
DLR has received much attention over the last decade from scholars and engineers alike, and very rightly so. The transition from static line rating, e.g. limiting line amp capacity to the most conservative meteorological scenario, to dynamic line rating, ideally requires localized and specific data on temperature, wind and rain, and ideally visuals down the line to monitor sag.
Especially in the context of the decentralization of power grids by the addition of ever-growing renewable energy generation capacity, DLR enables utilities to optimize usage of real line capacity and reduce congestion (cost), allows for more efficient and effective integration of intermittent power generation, and increases grid resilience and reliability. According to a study of the Idaho National Laboratory and the U.S. Department of Energy, where this data is available to power utilities, the average capacity increase of DLR over SLR amounts to 10-40%. (Gentle et.al., 2014) Studies conducted in Mexico and Uruguay have found up to 100% increases in line capacity possible through the integration of DLR technology. (Tarín-Santiso, Llamas, Probst, 2019)
The basic concept of DLR is that the lower the temperature, the higher the wind speed, the more heat dissipation from the power line, and thus higher the “reserve capacity” for the utility to pump more current through the line without overheating it. At the same time, the higher the line temperature, the more it expands, the smaller the conductor’s diameter, the less capacity, the more its sag, causing more structural stress through pull on the transmission towers, the latter being a widely overlooked aspect of existing DLR technology.
However, the main challenges remain communications and power for sensor technology, as most sensor manufacturers today still rely on external power and comms, whether it is ethernet, WiFi or the like, to keep their devices running and getting the data out.
At its most basic “better than nothing” topology, power utilities can utilize weather data available from public sources and manually calculate variations in line capacity. At a slightly more advanced stage, computational models can be used to model wind speeds along the line, taking into account local terrain topology. Another step up, specialized sensors measure conductor temperature and enable the utility to take informed decisions of further spare capacity in terms of ampacity.
The Achilles heel’, however, of all these approaches, is either the lack of localized (along the line) awareness and data to determine the point of lowest capacity, or the inability for real-time monitoring in remote areas without cellular coverage or other available communications options. And sometimes it is both.
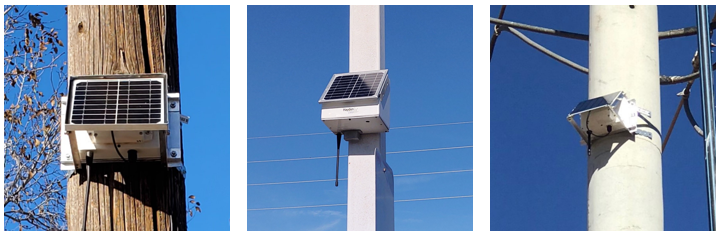
At Hayden Data we originally set out on a different objective, which was to make remote structural health and residual strength monitoring of power poles and transmission towers possible, and to make wildfires caused by failing utility poles a thing of the past.
The transmission network operators see in our system a unique way to make informed decisions on power line rating.
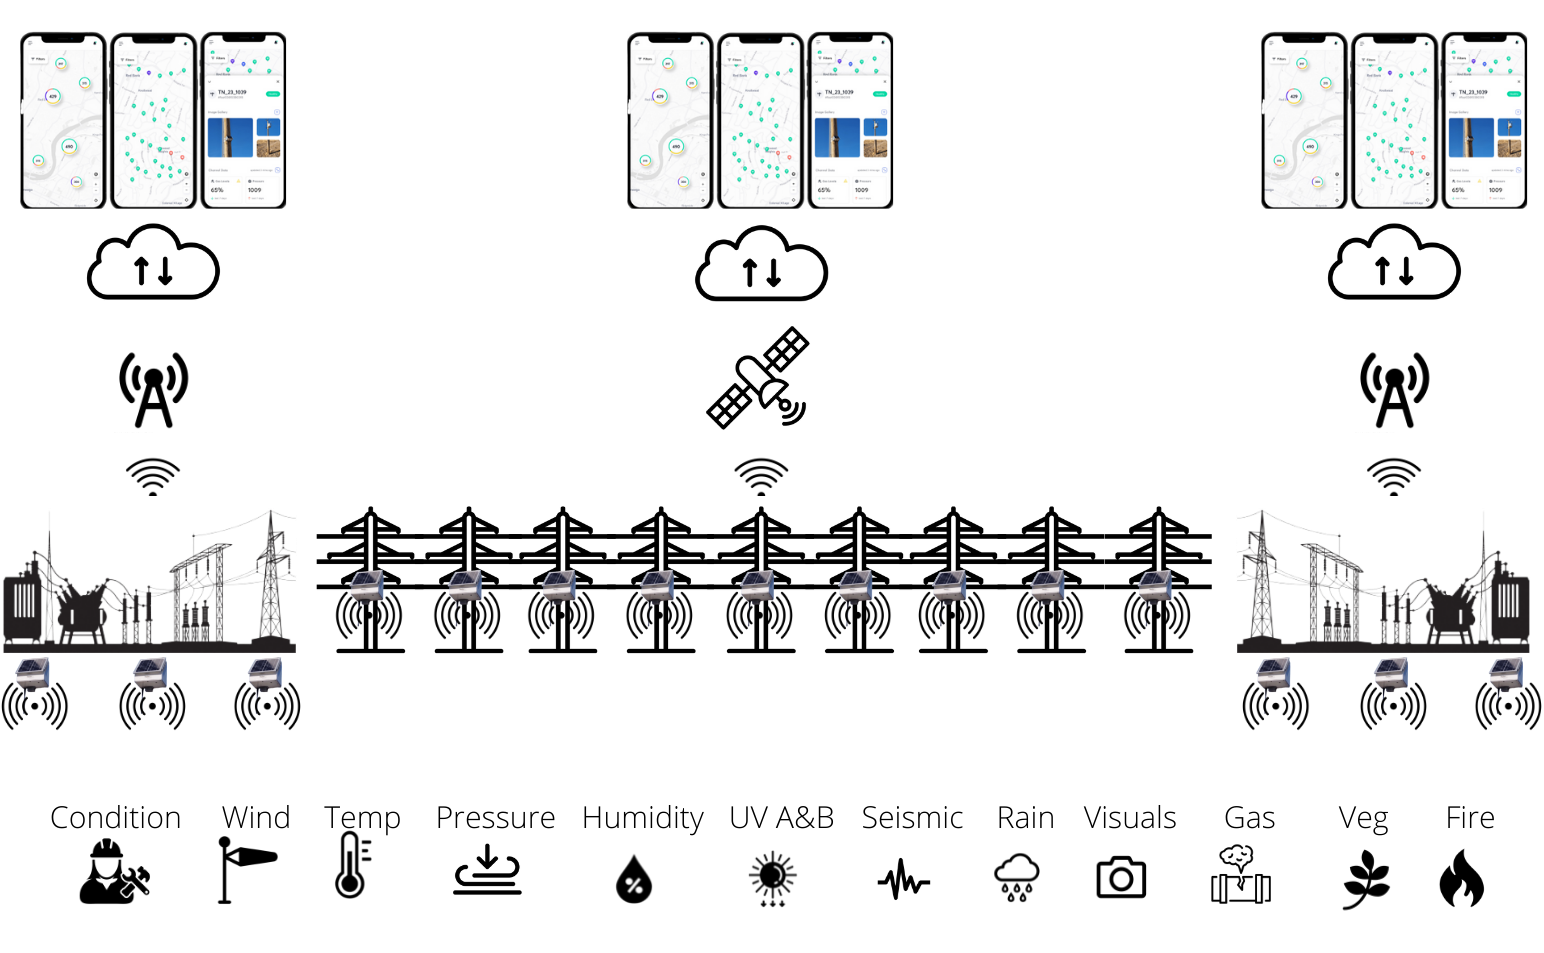
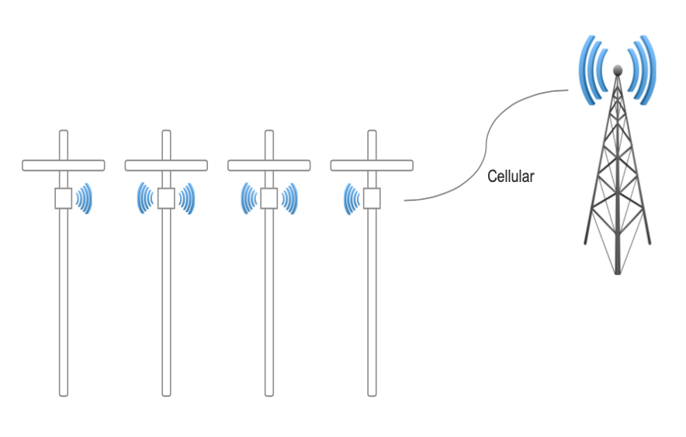
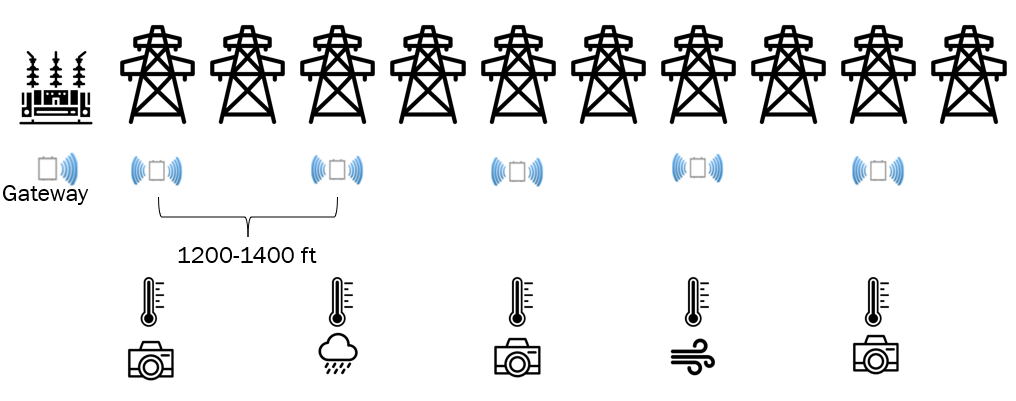
The uniqueness comes from the fact that Hayden Data smart sensors operate in a self-sufficient way in terms of communications and power; They are solar/battery powered, and even in the unlikely case of no solar re-charge would have an autonomy of 7 to 10 days. The units do not rely on locally available communication and data transfer options, but operate in a self-healing, bi- and multi-directional mesh network on a sub-1GHz frequency, passing the data along to gateway units that ideally are placed in an area with cellular coverage.
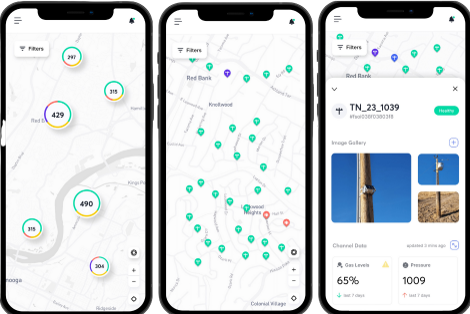
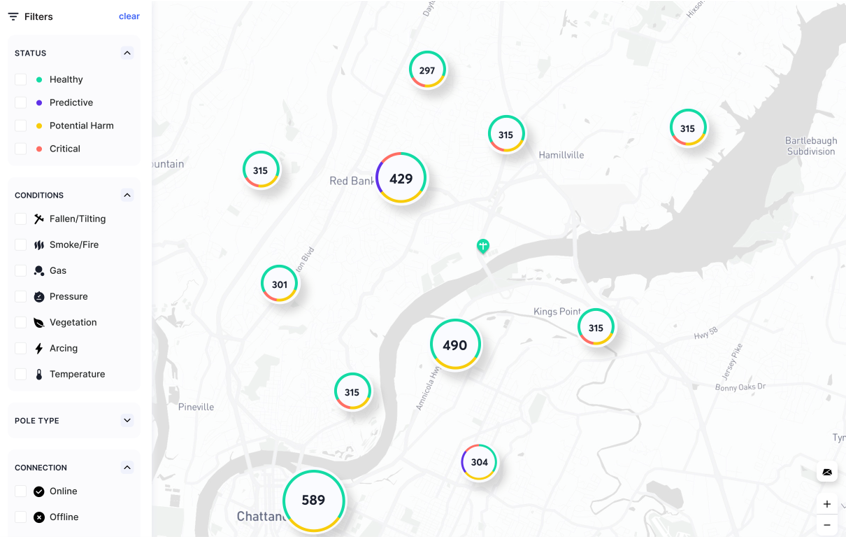
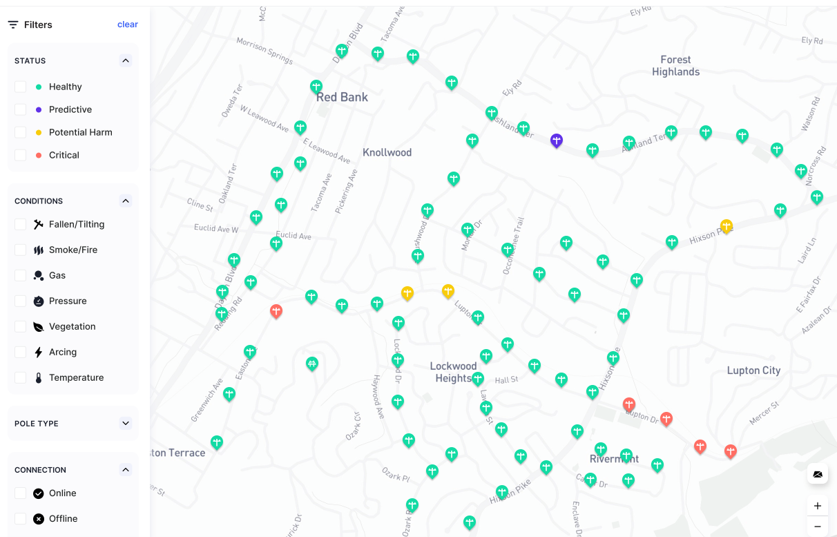
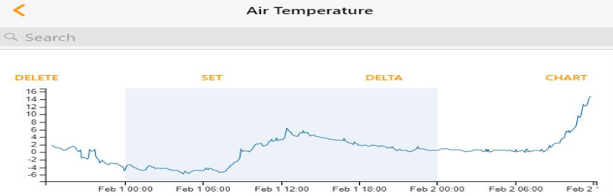
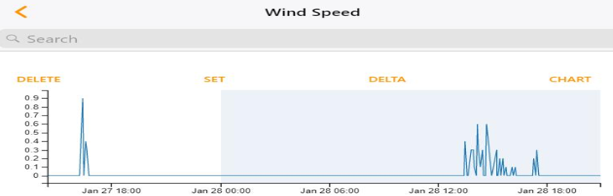
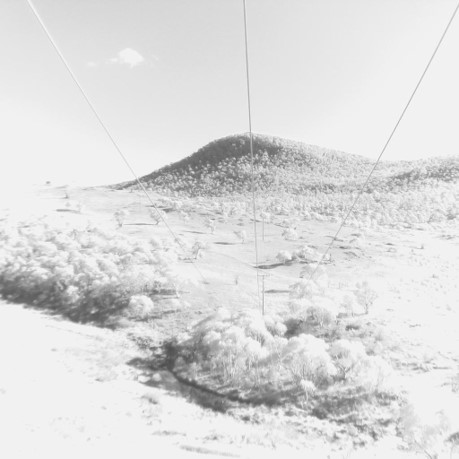
The units measure localized weather data along the power line, providing near-real time samples of temperature, wind speed and -direction, rain fall, pressure, humidity, as well as UV-A and UV-B, detect smoke levels and gas leaks, monitor power pole or tower movement to determine structural health and residual strength deterioration associated with excessive pull from sagging power lines, seismicity as well as potential collisions with vehicles. An onboard camera can be used to provide visual confirmation of line sag and help vegetation management in timed intervals or upon request. The data is available through an interactive online user interface at the user’s control room and/or mobile devices, even in the field.
To every gateway, we can currently connect up to 500 sensor devices, enabling Hayden Data Systems to go far into areas without signal and still be able to provide the full set of data from the entire system in near-real time. Satellite backhaul gateways provide additional redundancy, even in the most remote areas. As the units’ range surpasses by far the maximum communication range of the sub 1 GHz frequency, even failure, damage or vandalism of and to units does not affect connectivity, data availability and therefore the operation of the system.
With this data (ambient temperature, windspeed and -direction, pressure, humidity, rain fall as well as camera visuals for confirmation), Hayden Data Systems are able to help make informed and near-real time data-based decisions on how to dynamically rate power lines for areas where this information had not been available before. Due to our ongoing efforts in research and development in cooperation with the University of Tennessee at Chattanooga UTC, in the near future, we will add current, voltage as well as conductor temperature to the set of available data.
Contact us today to schedule a personalized webinar or a live demo, and experience how Hayden Data Systems are making the power grid ever more efficient, dynamic, safe and resilient!
References:
J. P. Gentle, K. S. Myers, J. W. Bush, S. A. Carnohan and M. R. West, “Dynamic Line Rating systems: Research and policy evaluation,” 2014 IEEE PES General Meeting | Conference & Exposition, National Harbor, MD, 2014, pp. 1-5, doi: 10.1109/PESGM.2014.6939880.
Tarín-Santiso, A., Llamas, A. and Probst, O., 2019. Assessment of the potential for dynamic uprating of transmission lines in the Mexican National Electric Grid. Electric Power Systems Research, 171, pp.251-263.